Cellular Imaging Systems
High-content imaging and high-content screening solutions, ranging from automated digital microscopy to high-throughput confocal imaging systems with modern machine learning analysis software.
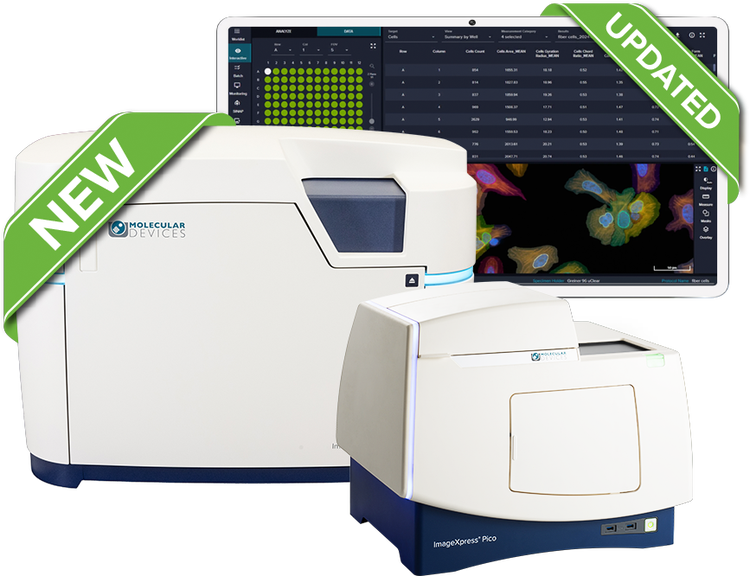
ImageXpress high-content screening solutions
High-content screening (HCS) is a cutting-edge approach in the fields of drug discovery and biological research that leverages advanced automated microscopy and sophisticated image analysis to gain deep insights into cellular behaviors and functions. By enabling the simultaneous examination of multiple cellular parameters—such as morphology, protein expression, and intracellular signaling—HCS provides a comprehensive understanding of cellular responses to various treatments and conditions.
Our high-content screening solutions combine the state-of-the-art ImageXpress® portfolio of high-content imaging systems with powerful high-content analysis (HCA) tools, including MetaXpress Image Acquisition and Analysis Software, complemented by our AI and machine learning-enabled IN Carta Image Analysis Software. An end-to-end solution for high-content imaging and analysis designed to streamline the complex workflows associated with high-content screening, delivering accurate, reproducible results that accelerate your scientific discoveries.
ImageXpress High-Content Screening Solution
Explore our portfolio of solutions that allow scientists to quickly narrow down vast drug compound libraries into manageable collections to quickly identify the most promising drug candidates.
High-content Imaging
ImageXpress high-content imaging systems combine best-in-class technology with high-performance customizations to maximize workflow efficiency and experimental design.
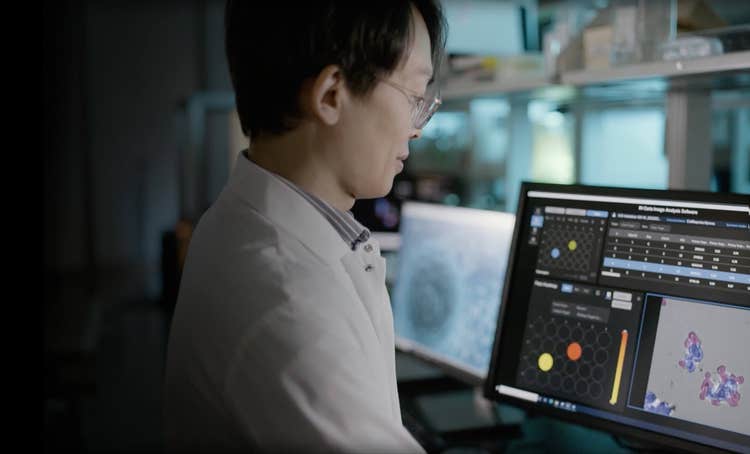
Imaging Acquisition and Analysis Software
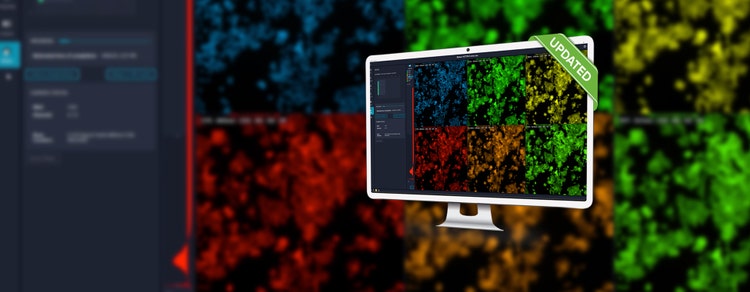
Our software solutions solve complex image analysis problems by utilizing advanced artificial intelligence and customized analysis protocols to transform complex assay images into robust results.
Automated, High-throughput, Screening Workflows
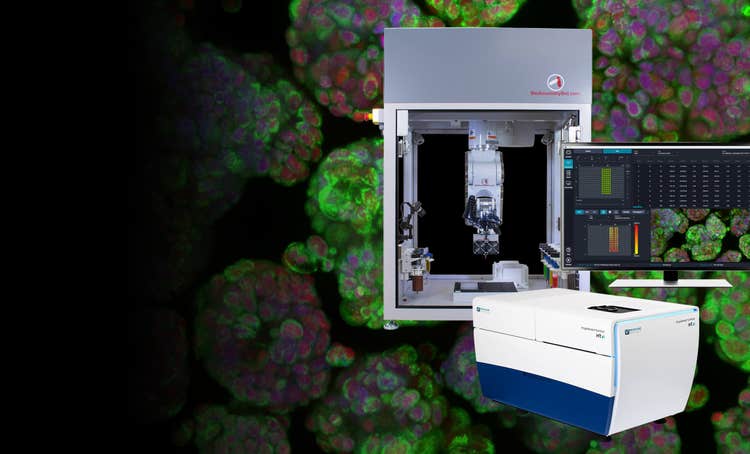
It's easier than ever to integrate automation into your lab. We offer turnkey and customized solutions that include experts who can automate entire workflows to meet the specific needs of your assay, method, or protocol. Take a tour of our newest offerings:
Explore our portfolio of high-content imaging and analysis systems
Our high-content imaging and analysis tools offer unparalleled precision and efficiency, empowering researchers to conduct robust, high-throughput experiments with ease. These tools offer flexible scalability, making it easy to evolve your system alongside your research needs. Designed with various options and modules including different imaging modes, objectives, filters, and environmental conditions—our comprehensive systems support a wide range of applications to increase throughput and streamline workflows, thus accelerating your scientific discoveries.
Which high-content imaging system is right for you?
camera
objectives
autofocus
plates-supported
temperature-control
96-well-plate-scan-time-2-colors-1-site-well
maximum-illumination-channels
robotics-automation-compatible

Researchers gain new insights into immune response during pediatric respiratory infections using the ImageXpress Pico system
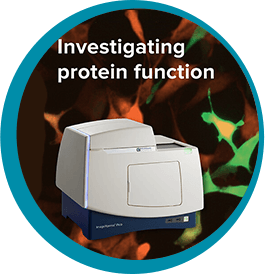
University of Leeds use ImageXpress Pico to investigate protein function
AI-Powered High-Content Screening
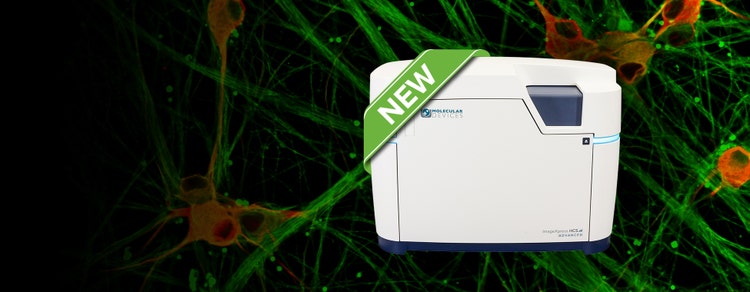
The ImageXpress® HCS.ai system with AI-driven analysis and revolutionary AgileOptix® Technology
Our ImageXpress HCS.ai High Content Screening System features the revolutionary AgileOptix® Technology for high-content screening (HCS). It’s a fully-integrated solution that addresses the many challenges associated with high-throughput complex 3D imaging. It combines an advanced solid-state light engine, water immersion objectives, a scientific CMOS sensor, and proprietary, dual spinning disk technology with five different disk geometries.
Increase imaging efficiency using our intelligent, QuickID Targeted Acquisition performed by the MetaXpress® Acquire High-Content Image Acquisition Software. Our AI-enabled solutions available in IN Carta™ Image Analysis Software provides a streamlined workflow with powerful deep learning-based segmentation, machine learning-based classification, and 3D volumetric analysis.
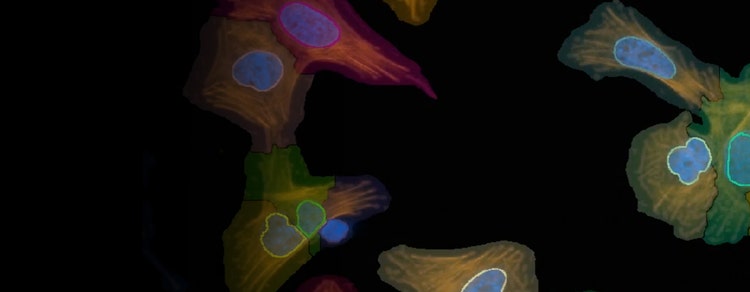
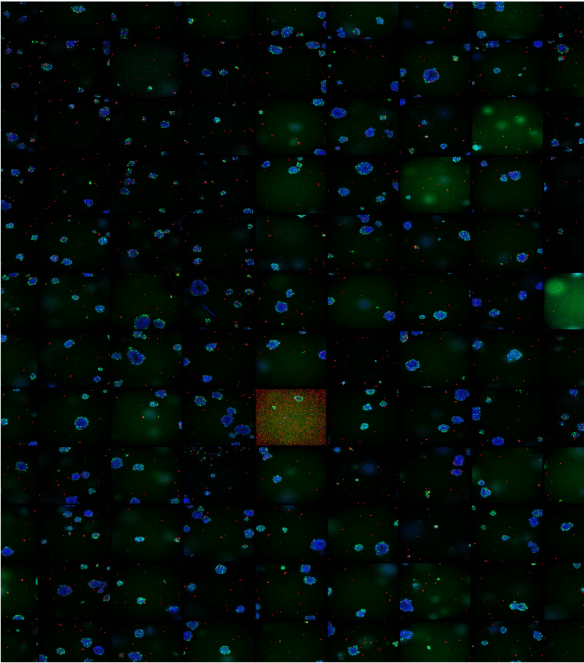
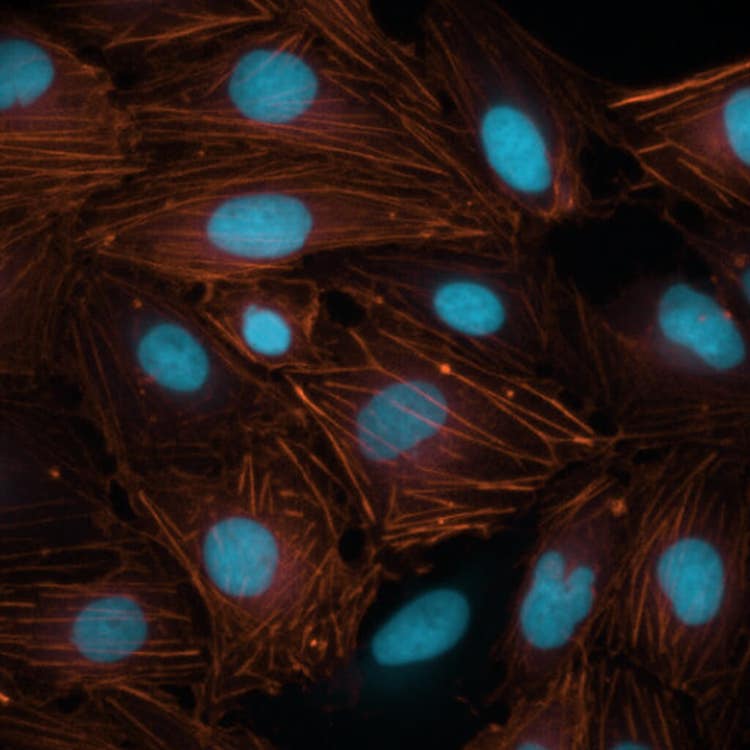
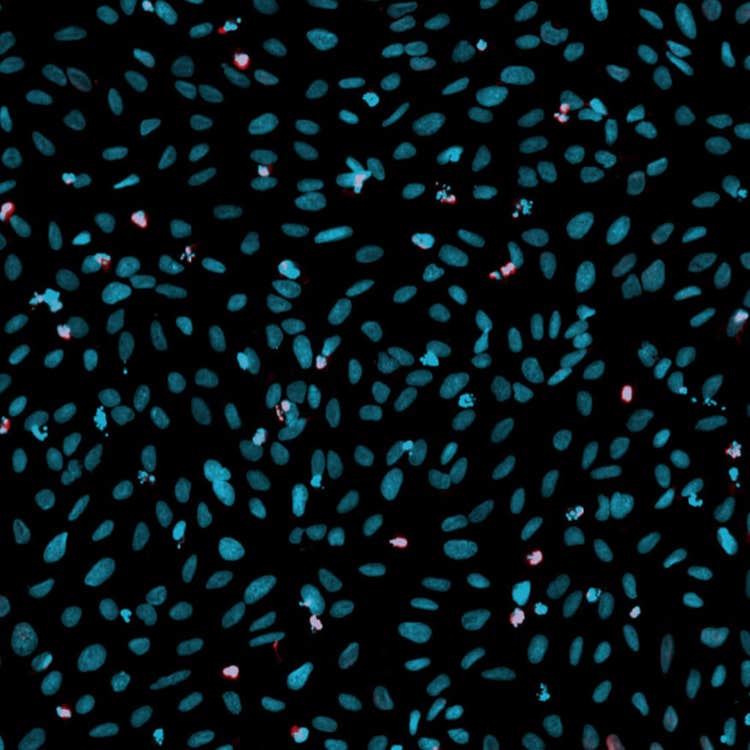
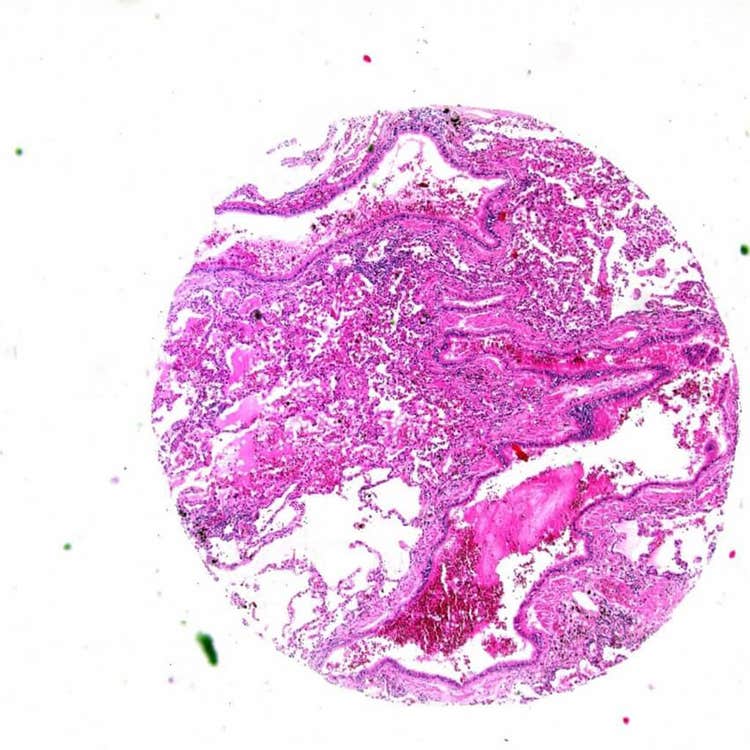
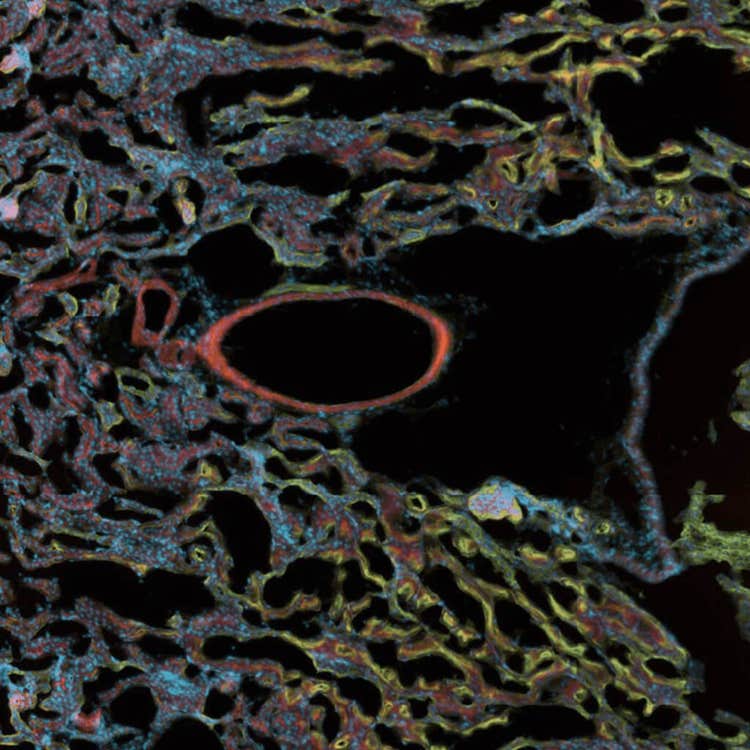
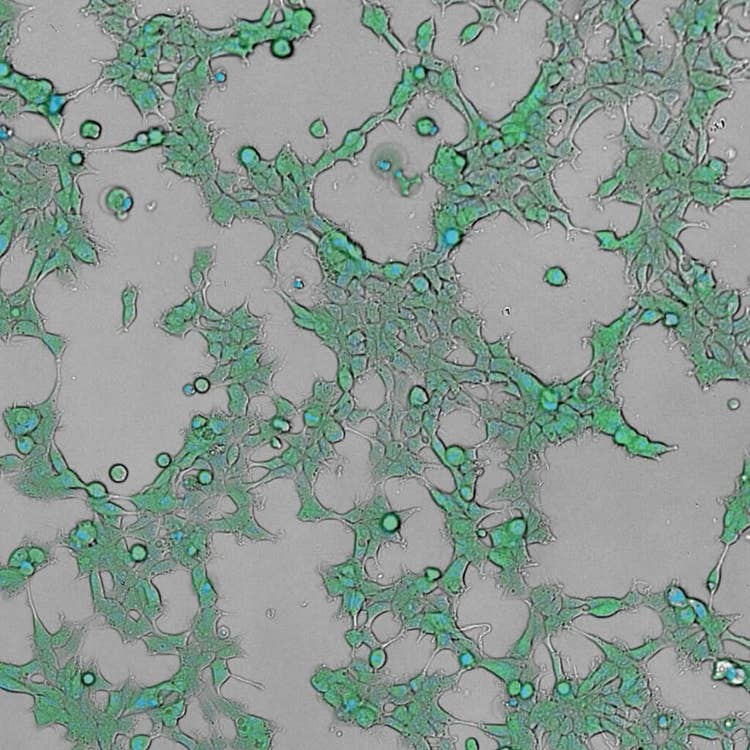
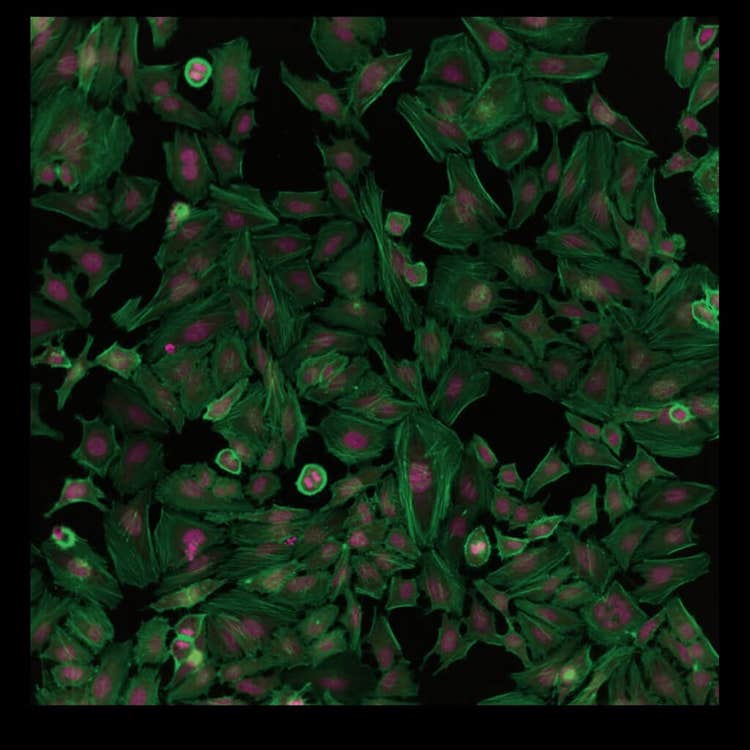
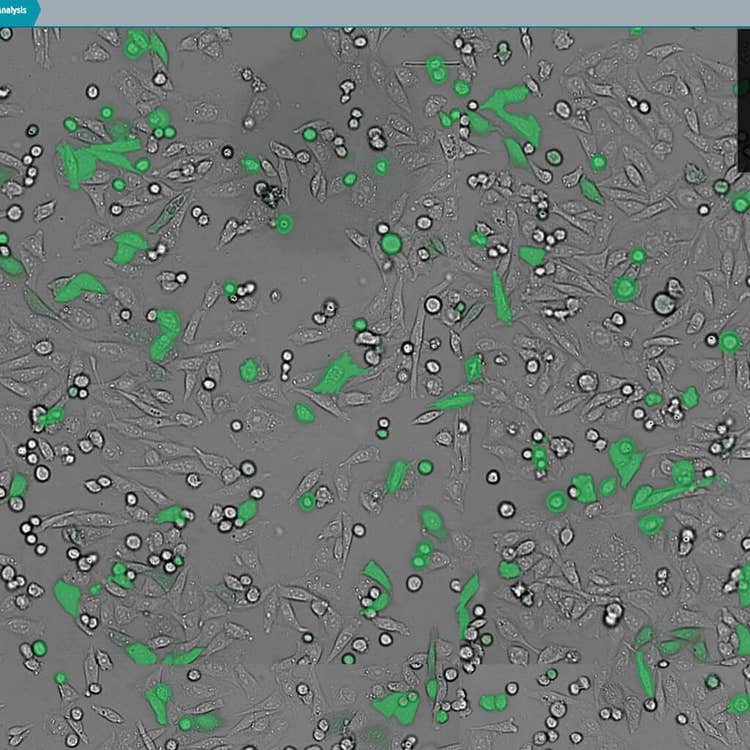
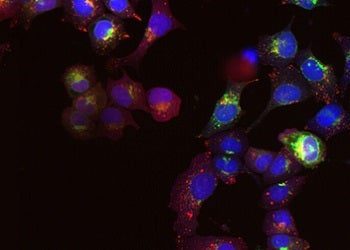
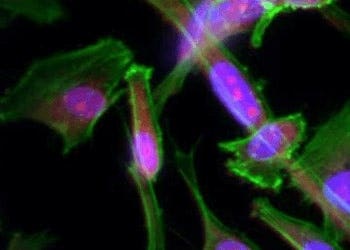
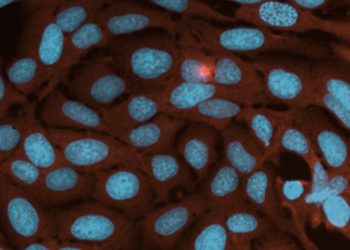
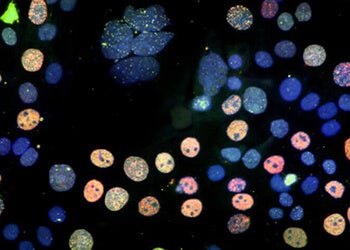
Cell Image Gallery
20 sites, stitched mouse kidney at 4X using the ImageXpress Nano system
iCell cardiotoxicity using the ImageXpress Pico system
DNA damage mask in U2OS cells using the ImageXpress Nano system
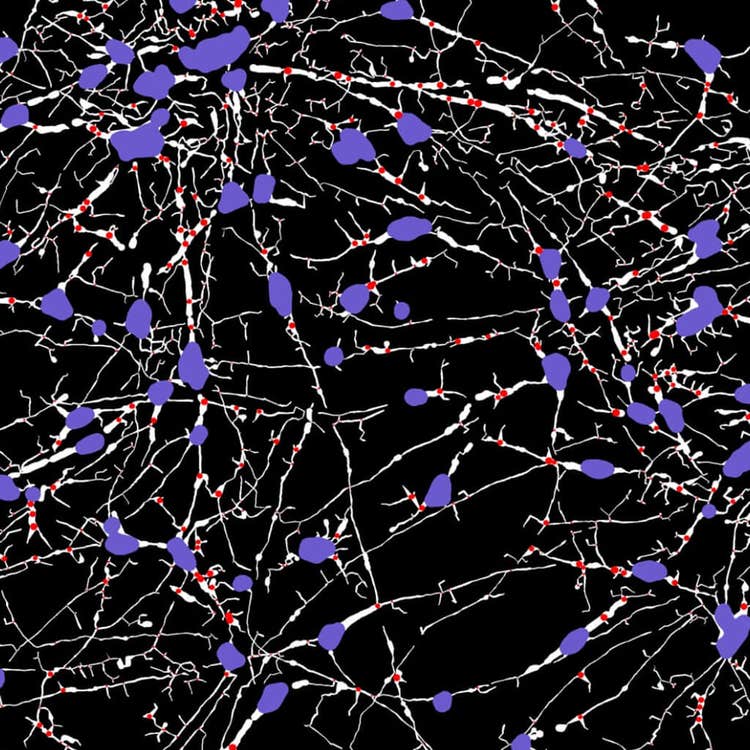
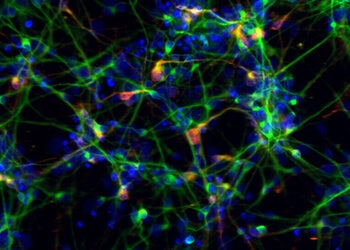
Stitched, neurite tracing mask at 40X using the ImageXpress Nano system
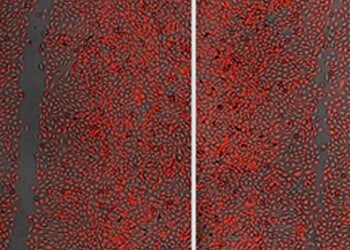
Cell morphology disruptors, acquired using the ImageXpress Nano system
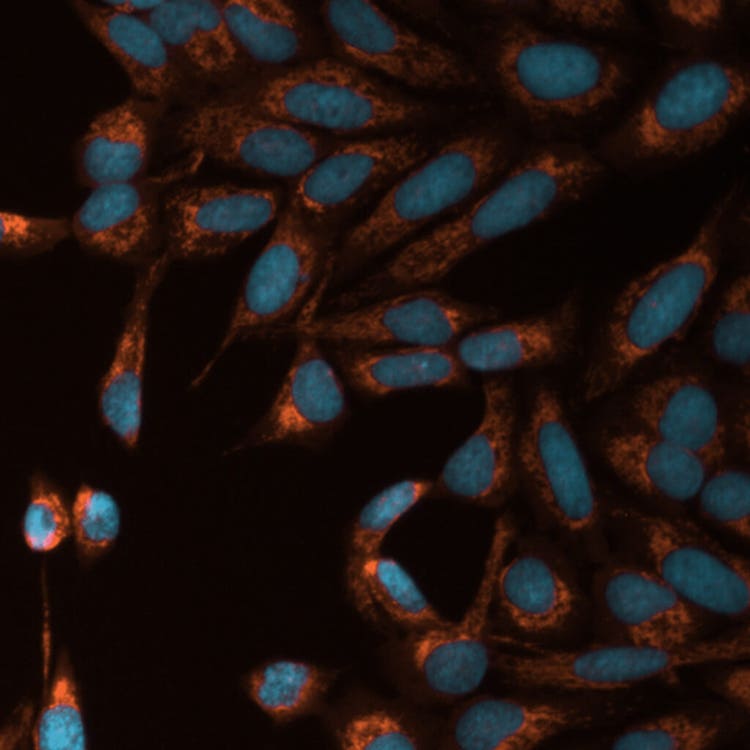
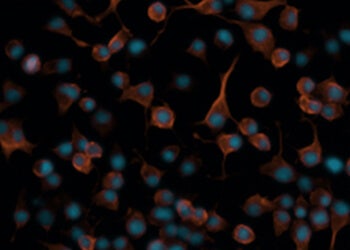
Mito toxicity with TRITC and DAPI using the ImageXpress Pico system
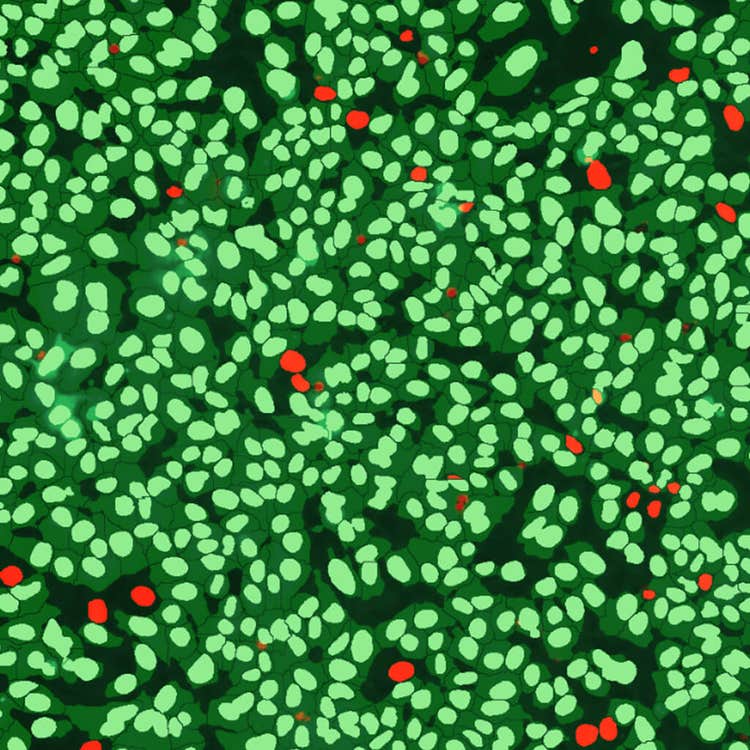
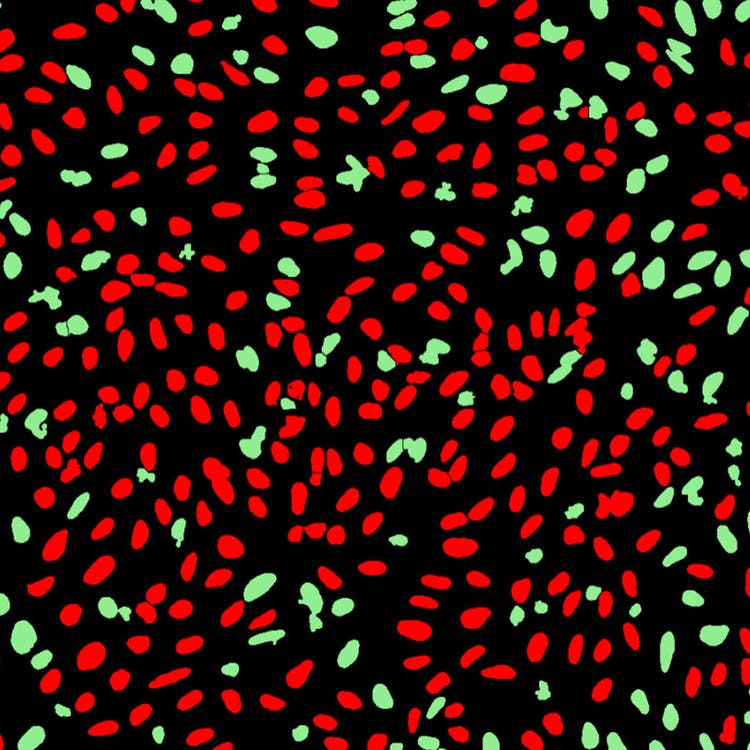
Live/dead control mask using the ImageXpress Pico system
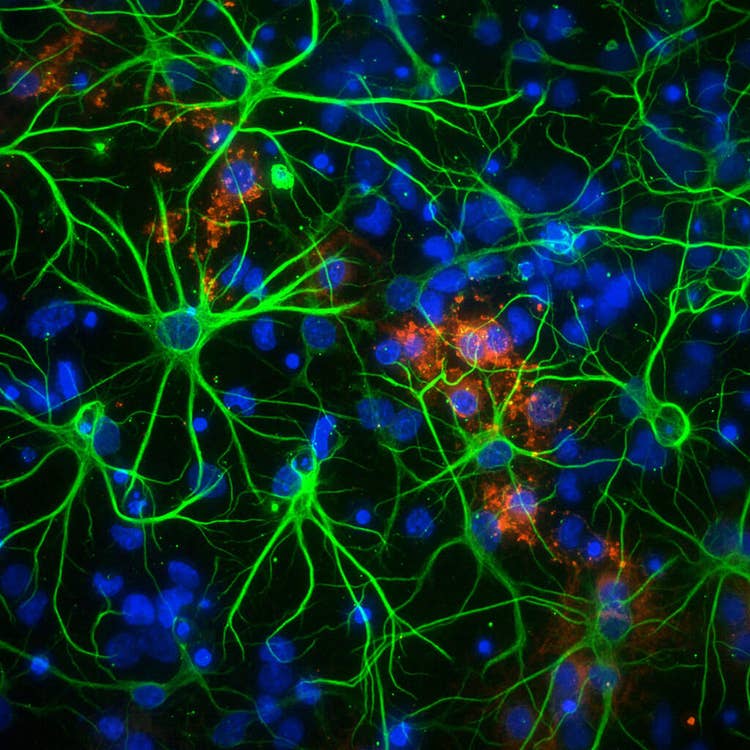
Neurons in 1536 well at 60X PA using the ImageXpress Micro Confocal system
Nuclei using phalloidin stain at 60X using the ImageXpress Nano system
DNA damage overlay in U2OS cells using the ImageXpress Nano system
Array on a slide using the ImageXpress Pico system
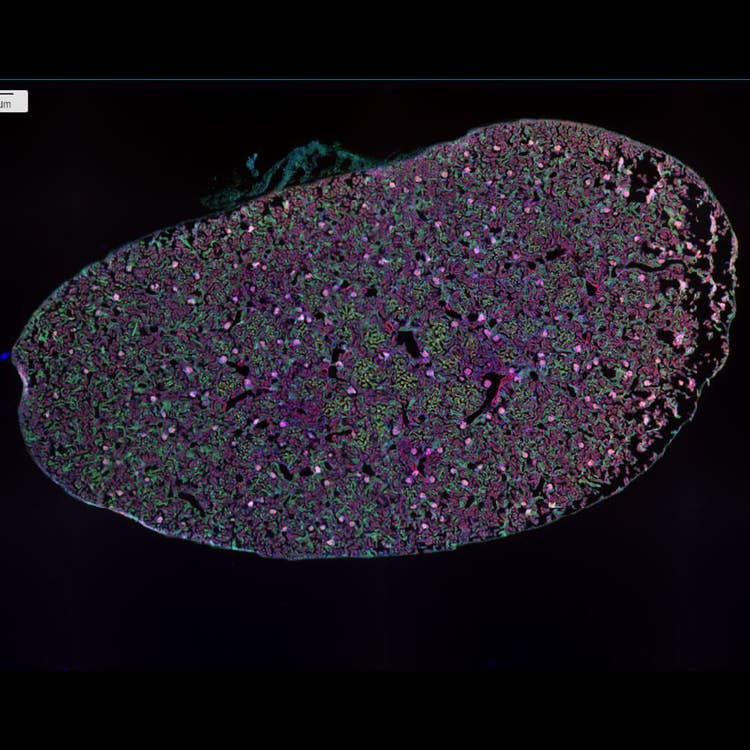
Fluorescent tissue.on a slide at 10X using the ImageXpress Pico system
HEK293 live cell timelapse, 2 color using the ImageXpress Pico system
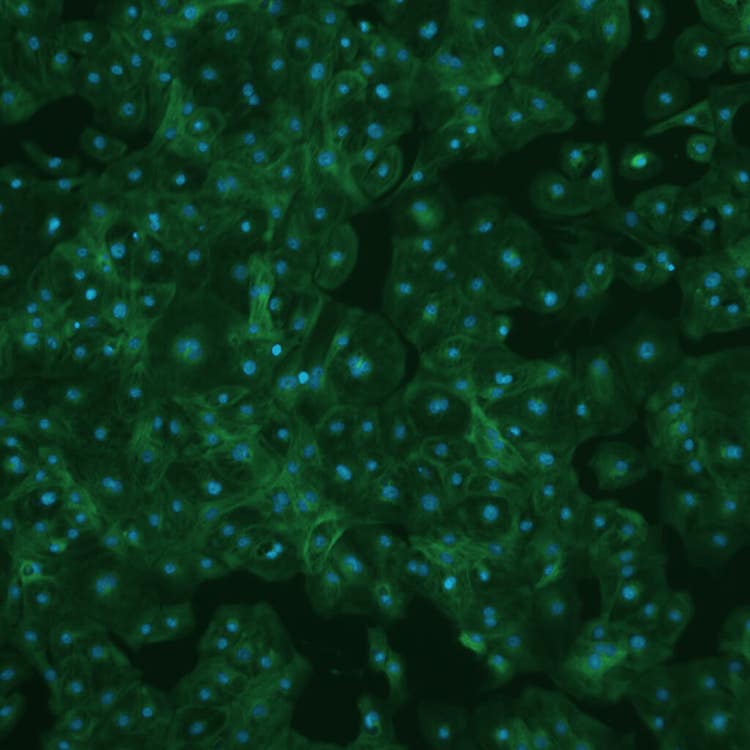
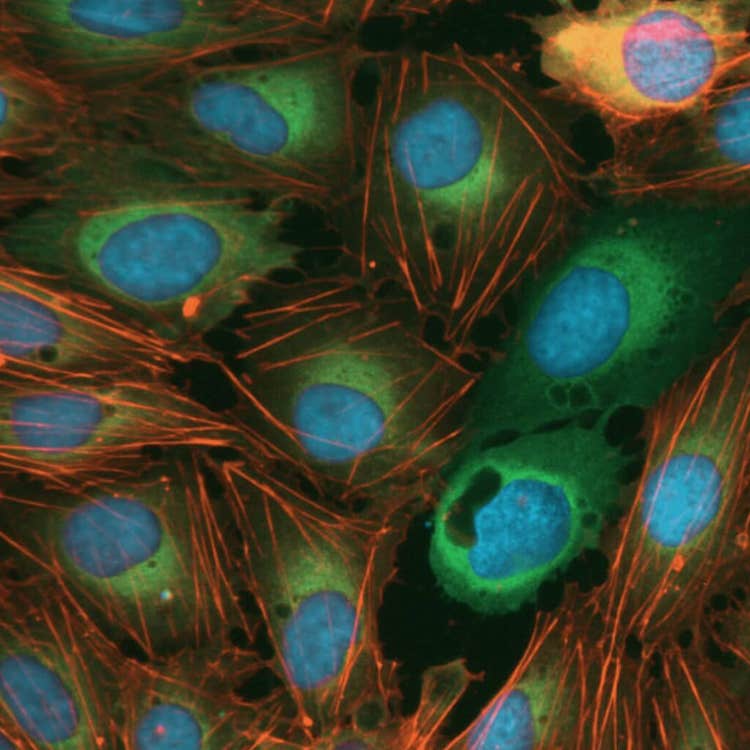
HeLa cell at 20X using the ImageXpress Pico system
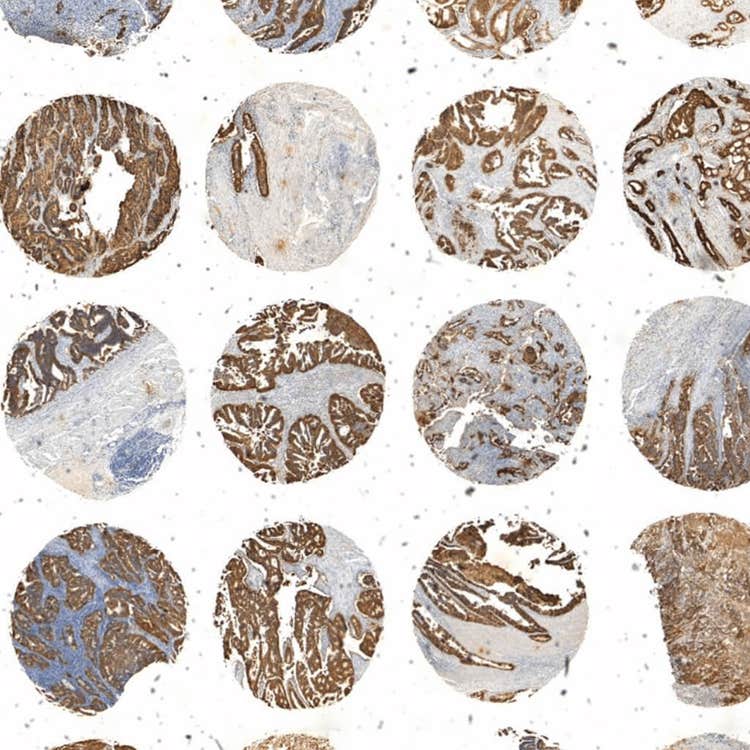
Array of tissue using the ImageXpress Pico system
Transmitted light and GFP overlay using CellReporterXpress software on the ImageXpress Nano system
Featured cell imaging applications
Cancer Research
Cancer involves changes which enable cells to grow and divide without respect to normal limits, to...
Cell Imaging
Researchers have several options in methods for imaging cells, from phase-contrast microscopy that...

3D Cell Models
Development of more complex, biologically relevant, and predictive cell-based assays for compound..
Live Cell Imaging
Live cell imaging is the study of cellular structure and function in living cells via microscopy....
Cell Counting
Here we discuss the various methods and techniques used to assess proliferation, cytotoxicity, or...
Cell Migration Assays
The movement or migration of cells is often measured in vitro to elucidate the mechanisms of...
Neurite Outgrowth
Neurite outgrowth is assessed by the segmentation and quantification of neuronal processes. These...
Stem Cell Research
Stem cells provide researchers with new opportunities to study targets and pathways that are more...